
 © Getty Images I Via Unsplash (1)")
Author Bryne Tan
Research Summary
The Monkeypox (Mpox) outbreak has re newed interest in using infectious dis ease modeling to predict and manage its spread. In this study, we apply an enhanced Susceptible-Exposed-Infectious Recovered (SEIR) model to the Mpox epi demic in the United States, incorporating vital dynamics such as births and deaths to account for long-term population changes. By extending the traditional SEIR frame work, our model captures more realistic in fection dynamics, offering deeper insights into transmission patterns, peak infection periods, and the eventual decline of the outbreak. This approach aims to provide a clearer understanding of Mpox transmis sion dynamics and to assist health authori ties in developing strategies to mitigate the spread. Our findings highlight the impor tance of early interventions and illustrate the potential for long-term epidemic con trol through strategic planning.
Introduction
ease modeling to predict and manage its spread. In this study, we apply an enhanced Susceptible-Exposed-Infectious Recovered (SEIR) model to the Mpox epi demic in the United States, incorporating vital dynamics such as births and deaths to account for long-term population changes. By extending the traditional SEIR frame work, our model captures more realistic in fection dynamics, offering deeper insights into transmission patterns, peak infection periods, and the eventual decline of the outbreak. This approach aims to provide a clearer understanding of Mpox transmis sion dynamics and to assist health authori ties in developing strategies to mitigate the spread. Our findings highlight the impor tance of early interventions and illustrate the potential for long-term epidemic con trol through strategic planning.
The SEIR model provides a basic framework for understanding the evolution of an epi demic [4] that divides the population into four segments: Susceptible (S), Exposed (E), Infectious (I), and Recovered (R). To model infectious diseases like Mpox more realisti cally, especially over an extended period, it is important to include vital dynamics, such as birth and death rates, in the SEIR model.
1
SEIR Model with Vital Dynamics
In the SEIR model with vital dynamics, the population is not fixed but changes over time due to births and deaths. This is particularly relevant for long-term modeling of diseases like monkeypox.
Mathematically, the SEIR model is expressed as a system of coupled ordinary differential equations given by:
dS(t)
dt = µN − βS(t)I(t)
N− µS(t)
dE(t)
dt = βS(t)I(t)
N− σE(t) − µE(t)
dI(t)
dt = σE(t) − γI(t) − µI(t)
dR(t)
dt = γI(t) − µR(t)
where:
• S(t), E(t), I(t), R(t) represent the populations of susceptible, exposed, infectious, and recovered individuals at time t, respectively.
• β is the transmission rate of the disease, reflecting how effectively the disease spreads.
• σ is the rate at which exposed individuals become infectious.
• γ is the recovery rate, indicating how quickly infectious individuals recover and move into the recovered class.
• µ represents the natural death rate, assumed to be equal across all compartments.
• N = S(t) + E(t) + I(t) + R(t) is the total population at time t, assumed constant in this model.
This set of equations models the flow of individuals through each compartment of the SEIR model, accounting for natural births and deaths, which are essential in maintaining the total population size and the dynamic nature of the disease transmission over time.
Modeling Monkeypox with SEIR and Vital Dynamics
Mpox can be modeled using the SEIR framework with vital dynamics, particularly if the disease is expected to persist in the population over a long period. This approach allows the model to account for changes in population due to births and deaths, which are crucial for understanding the long-term behavior of the disease. Specifically, the population is not fixed but changes over time due to these vital dynamics [1, 2].
2 Steps for Modeling
1. Determine Parameters:
• Transmission Rate (β): Reflects how easily Mpox spreads within the population.
• Incubation Rate (σ): The rate at which exposed individuals become infectious.
• Recovery Rate (γ): The rate at which infected individuals recover and become immune or are removed from the susceptible pool.
• Birth and Death Rates: Include natural population birth and death rates, along with disease-related mortality if applicable.
2. Implement the SEIR Model with Vital Dynamics:
• Use the differential equations provided above.
• Implement the model numerically, using numerical solvers in Python. 3. Analyze Results:
• Simulate the model over time to observe how monkeypox spreads, stabilizes, or declines in the population.
• Analyze the impact of different scenarios, such as vaccination, isolation, or changes in transmission rate, on the outbreak’s dynamics.
4. Interpret the Results:
• Understand the long-term impact of monkeypox on the population, considering vital dynamics.
• Explore public health strategies to mitigate the outbreak’s effects, including vaccination strategies, quarantine measures, and public health awareness.
Methodology
The primary data on Mpox cases was sourced from the Global Health website, specifically through their publicly accessible repository. The dataset, provided in CSV format, included daily reports on confirmed cases, recoveries, and other critical epidemiological metrics across various regions. This dataset was instrumental in serving as the foundation for the model’s input parameters. For the purposes of this study, we focused primarily on the US data due to its extensive and comprehensive coverage. By analyzing the trends and dynamics within the US, we aimed to generate insights that could be applied to other large, densely populated regions, offering predictions about potential outbreaks in similar environments.
3
Data Cleaning and Pre-processing
A Python script was utilized to refine the raw dataset, prioritizing variables crucial for the SEIR model. The refinement process was guided by the need to focus analysis on specific regions with significant data availability and clarity. The following steps were implemented:
• Handling Missing Data: Missing values in critical fields such as daily cases and deaths were managed using interpolation methods to maintain data integrity and continuity for time-series analysis. This approach ensures that temporal trends in the data are preserved, which is essential for accurate disease modeling.
• Removing Duplicates: Duplicate records were identified and removed based on unique identifiers including date and country. This step was crucial to ensure the reliability of the dataset, avoiding skewed data interpretation.
• Date Formatting: All dates were standardized to the ISO format (YYYY-MM-DD) to facilitate chronological analysis and modeling.
• Feature Selection and Exclusion: We streamlined the dataset by retaining only the most relevant features for epidemic modeling, such as Date, Location, New Cases, and Total Cases. Broad regional aggregates like continents were excluded to hone in on more granular, country-specific data, enhancing the model’s specificity and applicability to targeted public health responses.
• Data Verification: Post-refinement, data was verified for consistency and accuracy by visualizing trends in daily new cases across selected high-impact countries. This step not only validated the refinement process but also provided preliminary insights into the disease’s transmission dynamics.
The refined dataset was then exported for use in the SEIR model.
SEIR Model Setup
The SEIR model consists of four compartments:
• S (Susceptible): The number of individuals susceptible to infection. • E (Exposed): The number of individuals exposed but not yet infectious. • I (Infectious): The number of individuals actively spreading the disease.
• R (Recovered): The number of individuals that have recovered and are no longer infectious.
The transitions between these compartments are governed by parameters that represent the rate of infection, latency period, and recovery rate:
• β (Infection Rate): The rate at which susceptible individuals become infected after contact with infectious individuals.
• σ (Latency Rate): The rate at which exposed individuals progress to the infectious stage.
4
• γ (Recovery Rate): The rate at which infectious individuals recover and move to the recovered category.
The cleaned data was fed into the model, with population-specific parameters estimated for different regions based on the US epidemiological data.
Parameter Estimation and Fitting
The SEIR model parameters (β, σ, γ) were estimated using the following techniques:
• Nonlinear Least Squares Fitting: This was applied to minimize the difference between the model output and the observed data.
• Sensitivity Analysis: Performed to understand how changes in parameters affect the model’s accuracy.
• The SEIR model parameters (β, σ, γ) were estimated using techniques such as nonlinear least squares fitting [3].
Implementation
The cleaned data and estimated parameters were used in the Python package SciPy for numerical integration of the differential equations governing the SEIR model. The model was simulated over the time period corresponding to the dataset.
Step I:Optimisation with a Gaussian filter We applied the following approach:
• Data Smoothing: A Gaussian filter was applied to the raw data to smooth out irregularities caused by reporting delays and anomalies. This pre-processing step helps in reducing noise in the observed data and produces a more accurate representation of the epidemic curve.
• Parameter Optimization: The transmission rate (β), recovery rate (γ), and exposure rate (σ) were adjusted iteratively to minimize the least squares difference between the modeled infections and the smoothed actual data. This process refines the model to capture the infection dynamics accurately.
Results
The optimized SEIR model closely approximated the smoothed Mpox data from the United States. Key observations include:
• The early exponential growth of the epidemic was initially overestimated, likely due to limitations in early data.
• The model effectively captured the plateau phase, reflecting a slowing of infections attributed to public health measures and changes in population behavior.
5
• The eventual decline in case numbers was modeled with reasonable accuracy, offering valuable insights into the trajectory of the epidemic and the timing of control measures.
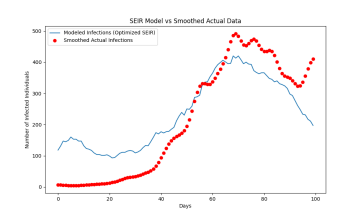
Figure 1: Comparison of Modeled Infections (Optimized SEIR) versus Smoothed Actual Data. The figure highlights the close alignment between the model’s predictions and the reported cases, showing the epidemic’s key phases: growth, plateau, and decline.
Discussion
The results underscore the effectiveness of a hybrid approach for optimizing the SEIR model to fit real-world epidemic data. By integrating data smoothing and parameter refinement, the model achieved a closer fit to the Mpox data. The refined model provided:
• A clearer delineation of the epidemic phases, particularly illustrating the impact of public health interventions.
• Enhanced predictions for future case trends, supporting improved planning for healthcare resource allocation and epidemic management.
Future improvements could include incorporating additional data sources such as vaccination rates or the geographic distribution of cases. Furthermore, exploring alternative smoothing techniques could help to better address issues such as missing data or irregular reporting patterns.
Conclusion
The optimized SEIR model, enhanced with Gaussian filtering, provides a robust framework for analyzing the Mpox epidemic in the United States. By aligning the model more closely with actual case data, it offers valuable insights for public health strategies and intervention planning. Continued refinement and validation using emerging data will be essential for maintaining the model’s accuracy and predictive power.
6
Step 2:Optimization of the Beta Parameter
The second step in refining the SEIR model involved a sensitivity analysis focused on the beta parameter, which dictates the transmission rate of the infection among the population. This parameter’s optimization is crucial as it directly influences the model’s accuracy in predicting the infectious spread.
Methodology
The sensitivity analysis was conducted by systematically varying the beta parameter within a predetermined range and observing the resultant changes in the model’s output. The objective was to minimize the discrepancy between the modeled infections and the smoothed actual data. The range for beta was set from 0.10 to 0.40, with increments of 0.01.
Results
The analysis revealed a nonlinear relationship between the beta parameter and the model error. Initially, the model error decreased significantly as beta increased from 0.10 to 0.25, indicating an improved fit to the actual data. However, beyond a beta of 0.25, the error began to increase sharply, suggesting overfitting at higher rates of transmission.
![]()
Figure 2: Sensitivity Analysis of the Beta Parameter
The optimal beta value was identified at approximately 0.25, where the model error was minimized, aligning closely with the trend observed in the smoothed actual infection data. This value was then used to adjust the SEIR model parameters for subsequent simulations.
7
Discussion
This sensitivity analysis underscores the importance of precise parameter estimation in epidemiological models. By optimizing beta, the SEIR model not only aligns more closely with actual data but also enhances its utility in predicting future outbreaks under similar conditions. The optimal beta reflects a balance between model sensitivity to new infections and realistic long-term predictions.
Further analysis could explore the interaction between beta and other model parameters, such as the incubation rate and recovery rate, to holistically improve the model’s predictive capability.
Validation Against Empirical Data
Post-optimization, the SEIR model was validated against smoothed actual infection data. This step was crucial to confirm the model’s efficacy in capturing the dynamics of the Monkeypox outbreak. The figure below illustrates the comparison between the modeled infections and the actual data, highlighting the model’s ability to replicate the observed epidemic curve accurately.
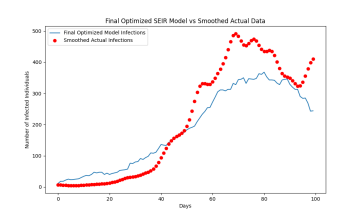
Figure 3: Comparison between the improved optimized SEIR model and smoothed actual infection data, demonstrating how the transmission rate affects the data fitting
These results indicate that the SEIR model, with an optimized β parameter, exhibits a closer alignment with the initial transmission phase and shows reasonable agreement during the plateau phase.
Step 3: Refined Approach to SEIR Modeling
The refined approach to modeling the SEIR model involved synthesizing data smoothing techniques and dynamic parameter optimization to better fit the observed epidemic data. The model was designed to capture the realistic dynamics of the epidemic by incorporating variations in the transmission rate over time, reflecting real-world phenomena such as public health interventions and behavioral changes.
8
Data Smoothing
The Gaussian smoothing technique allowed us to focus on the average behavior of transmission, rather than being influenced by daily fluctuations. This pre-processing step, implemented using a Gaussian filter, was essential in reducing noise and stabilizing the input data, enabling the model to capture the underlying trends without being skewed by daily reporting anomalies. The following code demonstrates the implementation:
smoothed_data = gaussian_filter1d(original_data, sigma=2)
Refined SEIR Model
The SEIR model equations were refined to include a time-dependent transmission rate (β(t)), which changes in response to interventions and other factors affecting the spread of the disease. This dynamic β(t) was modeled as an exponential decay function starting from an initial value, adjusting over time to simulate the effects of lockdowns or social distancing measures. The exponential decay reflect the decrease in the transmission rate after the initialisation of the lockdown.
Python Implementation:
def dynamic_beta(t, lockdown_start, lockdown_strength):
initial_beta = 0.3
if t < lockdown_start:
return initial_beta
else:
return initial_beta * exp(-lockdown_strength * (t – lockdown_start))
Parameter Optimization
Parameter optimization was performed using the minimize function from SciPy’s optimization module. The objective function was designed to minimize the root mean square error (RMSE) between the model’s predicted infections and the smoothed actual data. This method ensures that the model parameters are tuned to best fit the actual epidemic curve.
Python Implementation:
result = minimize(objective_function, initial_params, bounds=bounds)
Results
The optimized SEIR model provided a much closer fit to the actual data, effectively capturing the initial phase, peak, and overall average trend of the epidemic. The results demonstrate the effectiveness of the refined hybrid approach in optimizing the SEIR model for real-world applications [1, 2]. The figure below illustrates the comparison between the optimized model’s infections and the smoothed actual data, highlighting the model’s accuracy in simulating the epidemic dynamics.
9
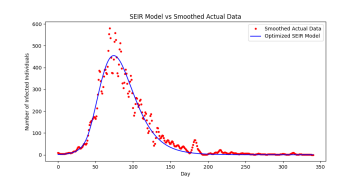
Figure 4: Comparison of the Optimized SEIR Model and Smoothed Actual Data
Optimized Parameters
The optimized parameters for the SEIR model with dynamic transmission rates are as follows:
Sigma (σ) : 0.1201
Gamma (γ) : 0.0500
Lockdown Start Day : 38.84
Lockdown Strength : 0.0609
These parameters suggest a relatively high infection rate, as indicated by the incubation parameter σ. In contrast, the recovery rate γ is lower, implying that individuals remain infectious for a longer period. The lockdown parameter, θ, affects the rate at which the
transmission rate decays once the lockdown is implemented, with higher values indicating faster reductions in transmission.
Equations of the Fit
The differential equations describing the SEIR model, with the dynamic transmission rate influenced by the lockdown parameters, are:
dS
dt = −β(t)SIN
dE
dt = β(t)SIN− σE
dI
dt = σE − γI
dR
dt = γI
where β(t) is defined by the lockdown model:
(
β(t) =
β0 if t < T β0 exp(−θ(t − T)) if t ≥ T
10
with:
• β0 = 0.3 (Initial transmission rate)
• T = 38.84 (Day lockdown starts)
• θ = 0.0609 (Lockdown strength)
Conclusion
Modeling the Mpox outbreak using the refined SEIR model, with optimized parameters σ = 0.1201, γ = 0.0500, a lockdown start day of approximately day 39, and a lockdown strength of θ = 0.0609, demonstrates significant improvements in fitting the epidemic curve. This means that after the lockdown, the transmission rate decreases exponentially—the rate of decrease depends on θ. These parameters suggest that the incubation period and recovery rate are well-captured by the model, while the dynamic transmission rate, β(t), effectively reflects the impact of interventions such as lockdowns. The model proves to be a robust tool for predicting and understanding the spread of Mpox as it closely matches observed data during the various phases of the outbreak, including the onset, peak, and decline. The lockdown-related parameters show that public health interventions significantly reduced transmission rates after day 39. Future work could explore dynamically modeling the lockdown parameter θ itself, giving health authorities a predictive tool for understanding how transmission rates evolve under different lockdown scenarios. Additionally, incorporating vaccination rates [3], geographic distribution, or public mobility indices could further enhance the model’s predictive power, particularly in forecasting the effects of differing intervention strategies on the long-term progression of the disease.
References
[1] Transmission dynamics of Monkeypox virus: a mathematical modelling approach. Modeling Earth Systems and Environment (Springer), 2022.
[2] Epidemiological modeling of monkeypox clades: a dual-strain SEIR approach with stability, bifurcation, and sensitivity analysis. Modeling Earth Systems and Environment (Springer), 2023.
[3] Mathematical assessment of monkeypox disease with the impact of vaccination using a fractional epidemiological modeling approach. Nature, 2023.
[4] Bjørnstad, O. N., Shea, K., Krzywinski, M., & Altman, N. The SEIRS model for infectious disease dynamics. Nature Methods, 17(6), 557–558, 2020. https://doi.org/10.1038/s41592-020-0856-2